Every other summer, the American Council for the an Energy Efficient Economy (ACEEE) releases its International Energy Efficiency Scorecard. This year’s report is now on the street, and we think there is a lot to learn from its smart analysis and insight.![]()
For many of us, this report provides an insightful and neutral assessment of our progress over the last year. By reviewing these rankings, we can learn a lot about the broad success of each country’s attempts to build paths to a sustainable future.
How Does North America Rank?
In our analysis of the 2014 ACEEE scorecard, published here, we bemoaned the fact that the U.S. and Canada had fallen far behind most countries in the developed world when it came to progress toward sustainable energy policies (coming in scarcely ahead of Mexico, India, and South Korea). And though there are a few bright spots in this year’s reports, the news this year is still sobering.

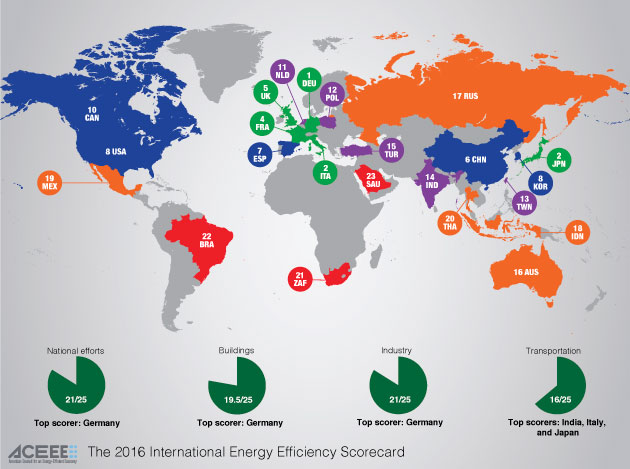
The overall ranking of countries included in the study places the U.S. at 8th and Canada at 10th.
The bad news is that the U.S. and Canada still do a laughably bad job at transportation, with scores that leave them trailing behind South Korea, Brazil, China, India, and most of Europe. The good news comes from the building sector, where the U.S. is granted the 2nd position, behind Germany, and Canada scores 5th.
How Are the Scores Calculated?
It’s revealing to look at how the scores are calculated. Though we’re know that it’s possible to manipulate statistics to prove any point, we have a lot of respect for the even-handed methodology behind the ACEEE analysis. After all the deep statistical analysis, the researchers assign numerical values for various attributes of energy efficiency. The total score for each country could reach 100, though no one country earned more than 73. These points are spread evenly at 25 for each of four categories:
- National effort
- Buildings
- Industry
- Transportation
Within the Buildings category, the analysis includes an evaluation of eight sub-categories:
- Appliance and building standards
- Residential building codes
- Commercial building codes
- Building retrofit policies
- Building labeling
- Appliance and equipment labeling
- Energy intensity in residential buildings
- Energy intensity in commercial buildings
Researchers at ACEEE re-visit the weighting of these categories when developing each new scorecard. In the Buildings category, for example, the 2016 report changed the 2014 weighting by giving additional weighting to residential building codes, commercial building codes, and building retrofit policies. Less weight was given to the actual energy intensity of buildings, an approach that will surely will generate controversy among industry analysts.
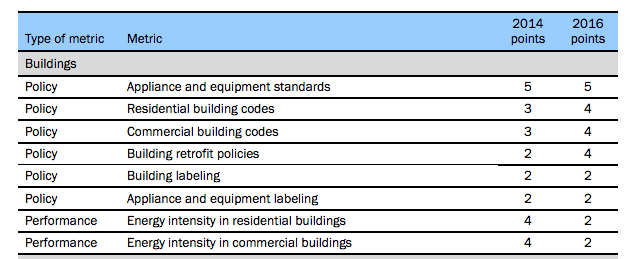
The value given to each attribute is re-evaluated for each scorecard. Each category, such as Buildings shown here, is assigned 25 points.
Our Summary
All in all, we find the 2106 scorecard to be a good take on progress made by the major countries of the world as they develop different paths toward energy sustainability. It’s helpful to all of us that a respected player such as ACEEE dedicates the resources to doing this review. As in any such analysis, there is something here for everyone to love or hate, depending on your own views on culture, policy, and technology. But if you have more interest, we recommend you download, read, and save the entire report.
— Chris Dorsi
Learn more at the ACEEE website.
Download the 2.4 MB PDF report here.